Race Stats Guide
The Stats page gives you a deeper look at race performance — beyond just the final standings. It shows per-racer statistics, lane fairness analysis, den comparisons, memorable moments from the event, and CSV exports for your records.
Note
Prerequisite: At least one heat must be completed before the Stats page shows data. If no heats have been run yet, the page will display "No heat results recorded yet."
Note
Free race heats never appear here. Practice and exhibition runs are excluded from every number on this page.
Navigating to the Stats Page
Click the Stats tab in the race navigation bar at the top of any race page. The Stats page is read-only — it shows results that were recorded on the Race Control page.
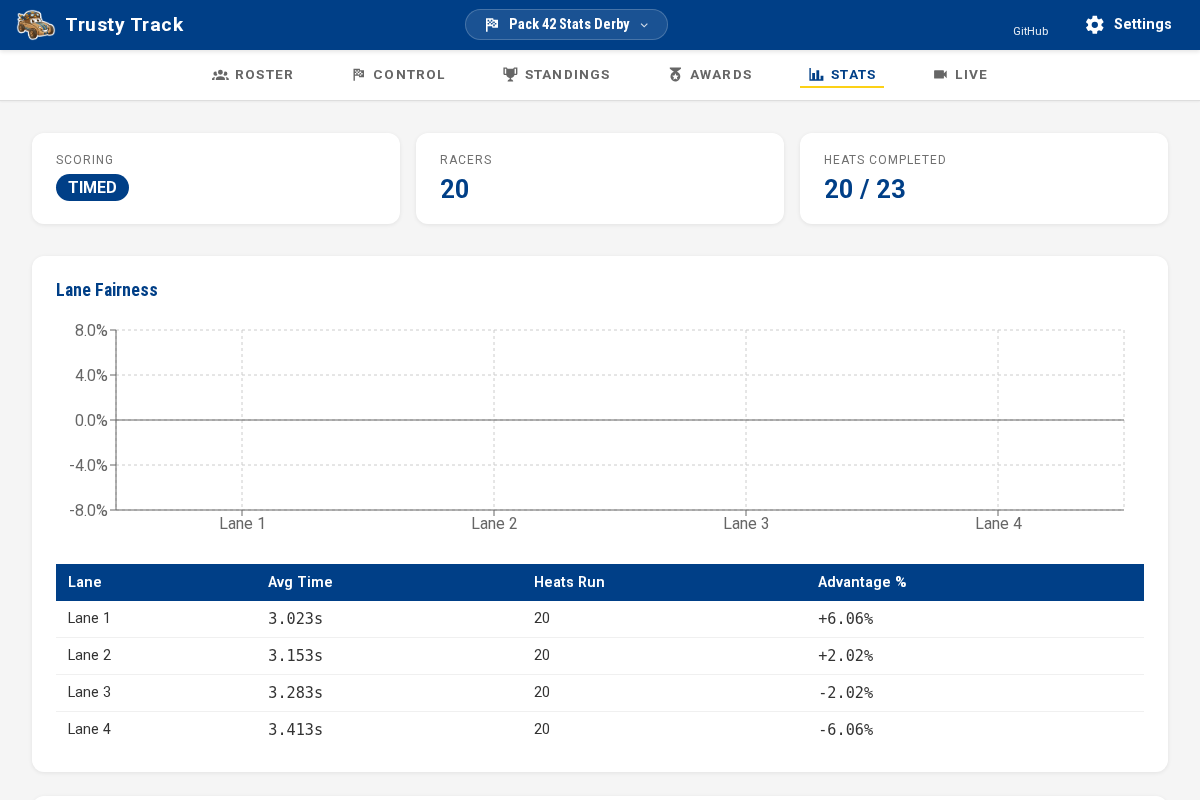 Click the Stats tab in the race navigation bar to open the Stats page.
Overview Cards
At the top of the page, three summary cards give you a quick snapshot of the race:
- Scoring — the scoring method in use (e.g., "TIMED" for fastest average time).
- Racers — the total number of registered racers.
- Heats Completed — how many heats have been run out of the total scheduled (e.g., "12 / 16").
 The three overview cards at the top of the Stats page show scoring strategy, racer count, and heat completion progress.
Lane Fairness
Pinewood Derby tracks sometimes have lanes that are slightly faster or slower due to small variations in the track surface or construction. The Lane Fairness section helps you see if any lane has a consistent advantage or disadvantage.
- The bar chart shows each lane's performance relative to the overall average. A bar above the centre line (blue) means that lane runs faster than average; a bar below it (gold) means slower than average.
- The table below shows each lane's average finish time, how many heats were run in that lane, and the percentage advantage or disadvantage.
A small difference (less than 1%) between lanes is completely normal. A larger difference may be worth noting for future track maintenance.
Tip
This section is most meaningful after a full qualifying round, where every racer has run in every lane — which is exactly how Trusty Track's automatic scheduling works.
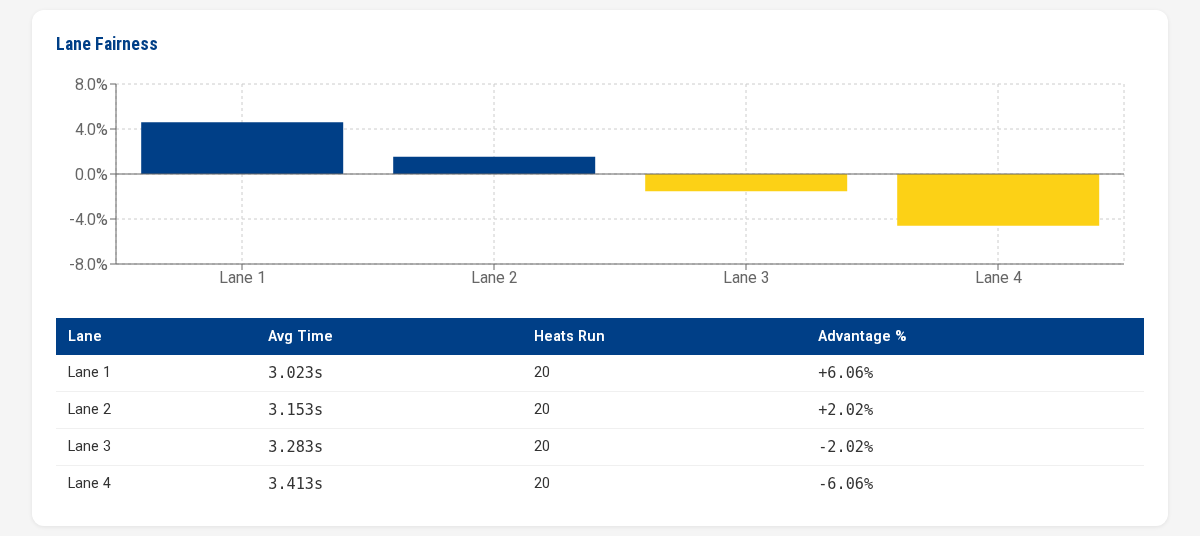 The Lane Fairness section. Blue bars rise above the line for faster-than-average lanes; gold bars drop below it for slower ones.
Per-Racer Stats
The Per-Racer Stats table shows every racer's numbers: heats completed, fastest and slowest time, average, and how consistent their times were. Every column except Den sorts — click its header, and click again to reverse.
What each column means exactly is in Stats and exports.
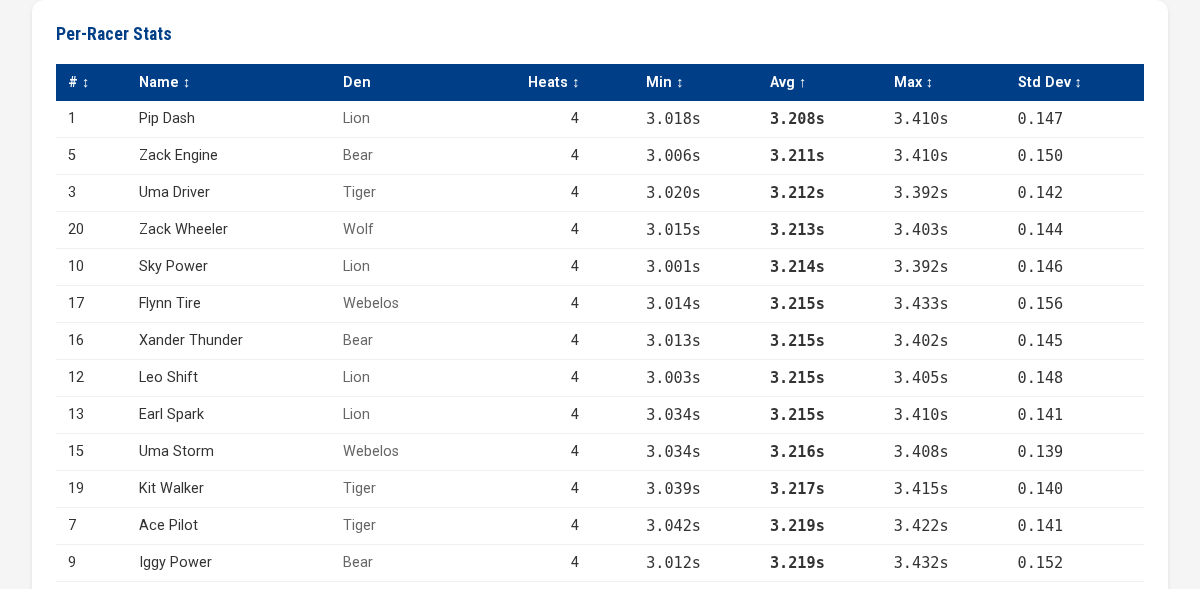 The Per-Racer Stats table sorted by average time (the default). Click a sortable column header to re-sort.
Top Moments
The Top Moments section highlights two memorable heats from the event:
- Fastest Heat — the single quickest recorded time of the entire event, with the racer's name and which heat it occurred in. If the track has scale speed turned on, a real-world MPH shows underneath it.
- Closest Race — the heat where the margin between the fastest and slowest finisher was smallest (the most exciting race of the day), with the time gap in seconds.
These cards appear automatically once enough heats have been completed.
 The Top Moments section highlights the fastest heat of the day and the closest finish — with the fastest heat's real-world scale speed shown underneath, since this track has that turned on.
Track Record
The Track Record section looks beyond today: the fastest cars this track has ever seen, across every race run on it.
- The card shows the record — the time, who set it, and at which event.
- The table below lists the five fastest cars of all time.
- A record set at today's event gets a gold badge. Beating a record that has stood since last year is worth announcing.
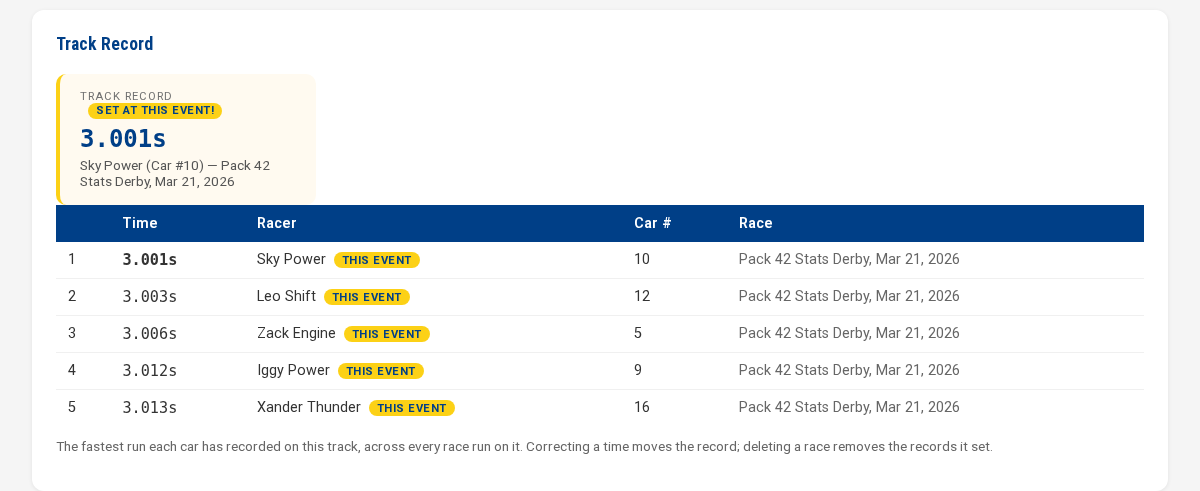 The track record card, with the all-time list beneath it.
Records from before Trusty Track
If your pack has records on paper — "2.89 seconds, Jimmy, 2019" — you can enter them so the board tells the whole story:
- Go to Settings, and find the track's card under Tracks.
- Under Track records from past years, type the time and the racer's name — car number, event and date are optional.
- Click Add record. It saves straight away.
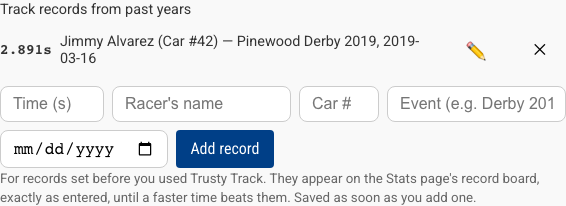 A record from 2019, entered on the track's card in Settings.
An entered record competes exactly as typed: it heads the board until a faster time actually beats it. The ✏️ corrects a typo and the ✕ removes one.
Exactly what counts toward a record is in Stats and exports.
Den Comparison
The Den Comparison section shows how each den performed as a group — useful for pack leadership who want to recognize standout dens at the awards ceremony.
- The bar chart plots each den's average score, with bars colored in the den's assigned color.
- The table shows each den's racer count, group average score, and the name of that den's best-performing racer.
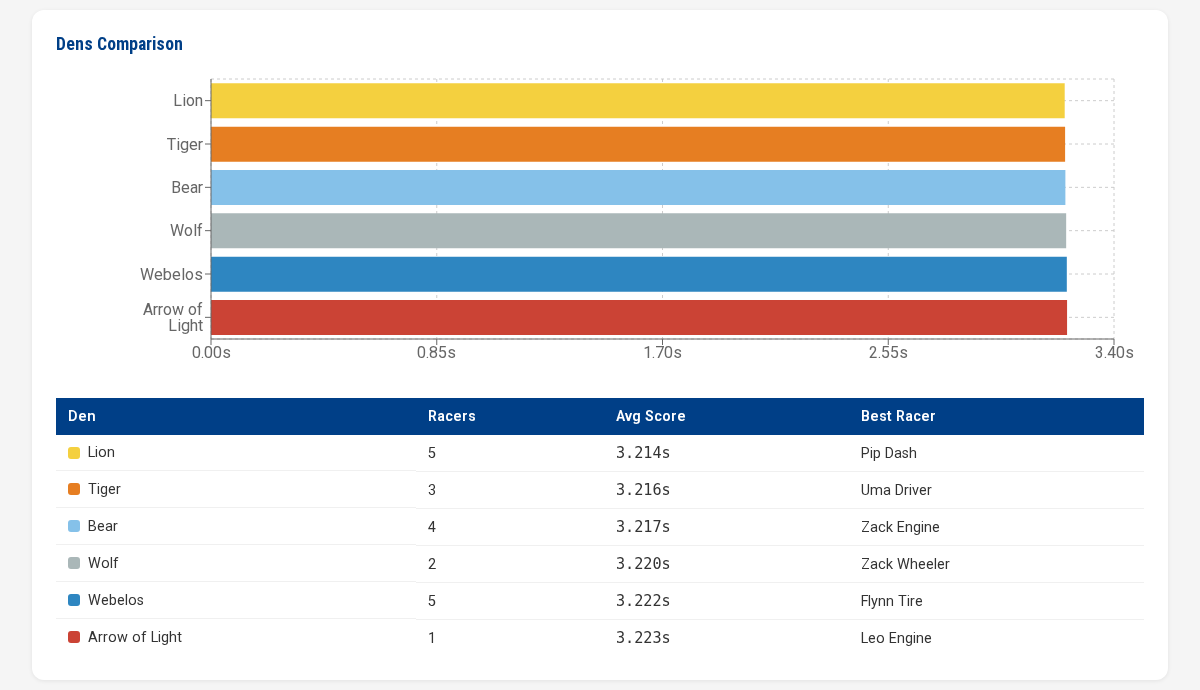 The Den Comparison section. Each bar is colored in the den's assigned color, making it easy to match the chart to the table below.
Exporting Results
Two Export buttons at the bottom of the page download race data as CSV files that open in Excel, Google Sheets, or any spreadsheet:
- Export Heat Results — one row for every lane in every completed heat. The complete record of the event.
- Export Racer Stats — one row per racer with their numbers. For awards, records, or sharing with the pack afterwards.
 The Export section at the bottom of the page. Both buttons download CSV files that open in any spreadsheet application.
The final placings export from the Standings page instead — Export CSV beside the round selector, holding whatever standings the page is showing.
The exact columns in all three files are in Stats and exports.
Live Updates During the Race
The Stats page updates automatically while the race is in progress. As each heat is completed in Race Control, the charts and tables refresh within a few seconds — no manual refresh needed.
This means you can keep the Stats page open on a separate screen during the race and use it as a running analysis view for pack leadership, while the race operator uses the Race Control page to run heats.
The Heats Completed card at the top shows the current progress, so you always know how much of the race remains.
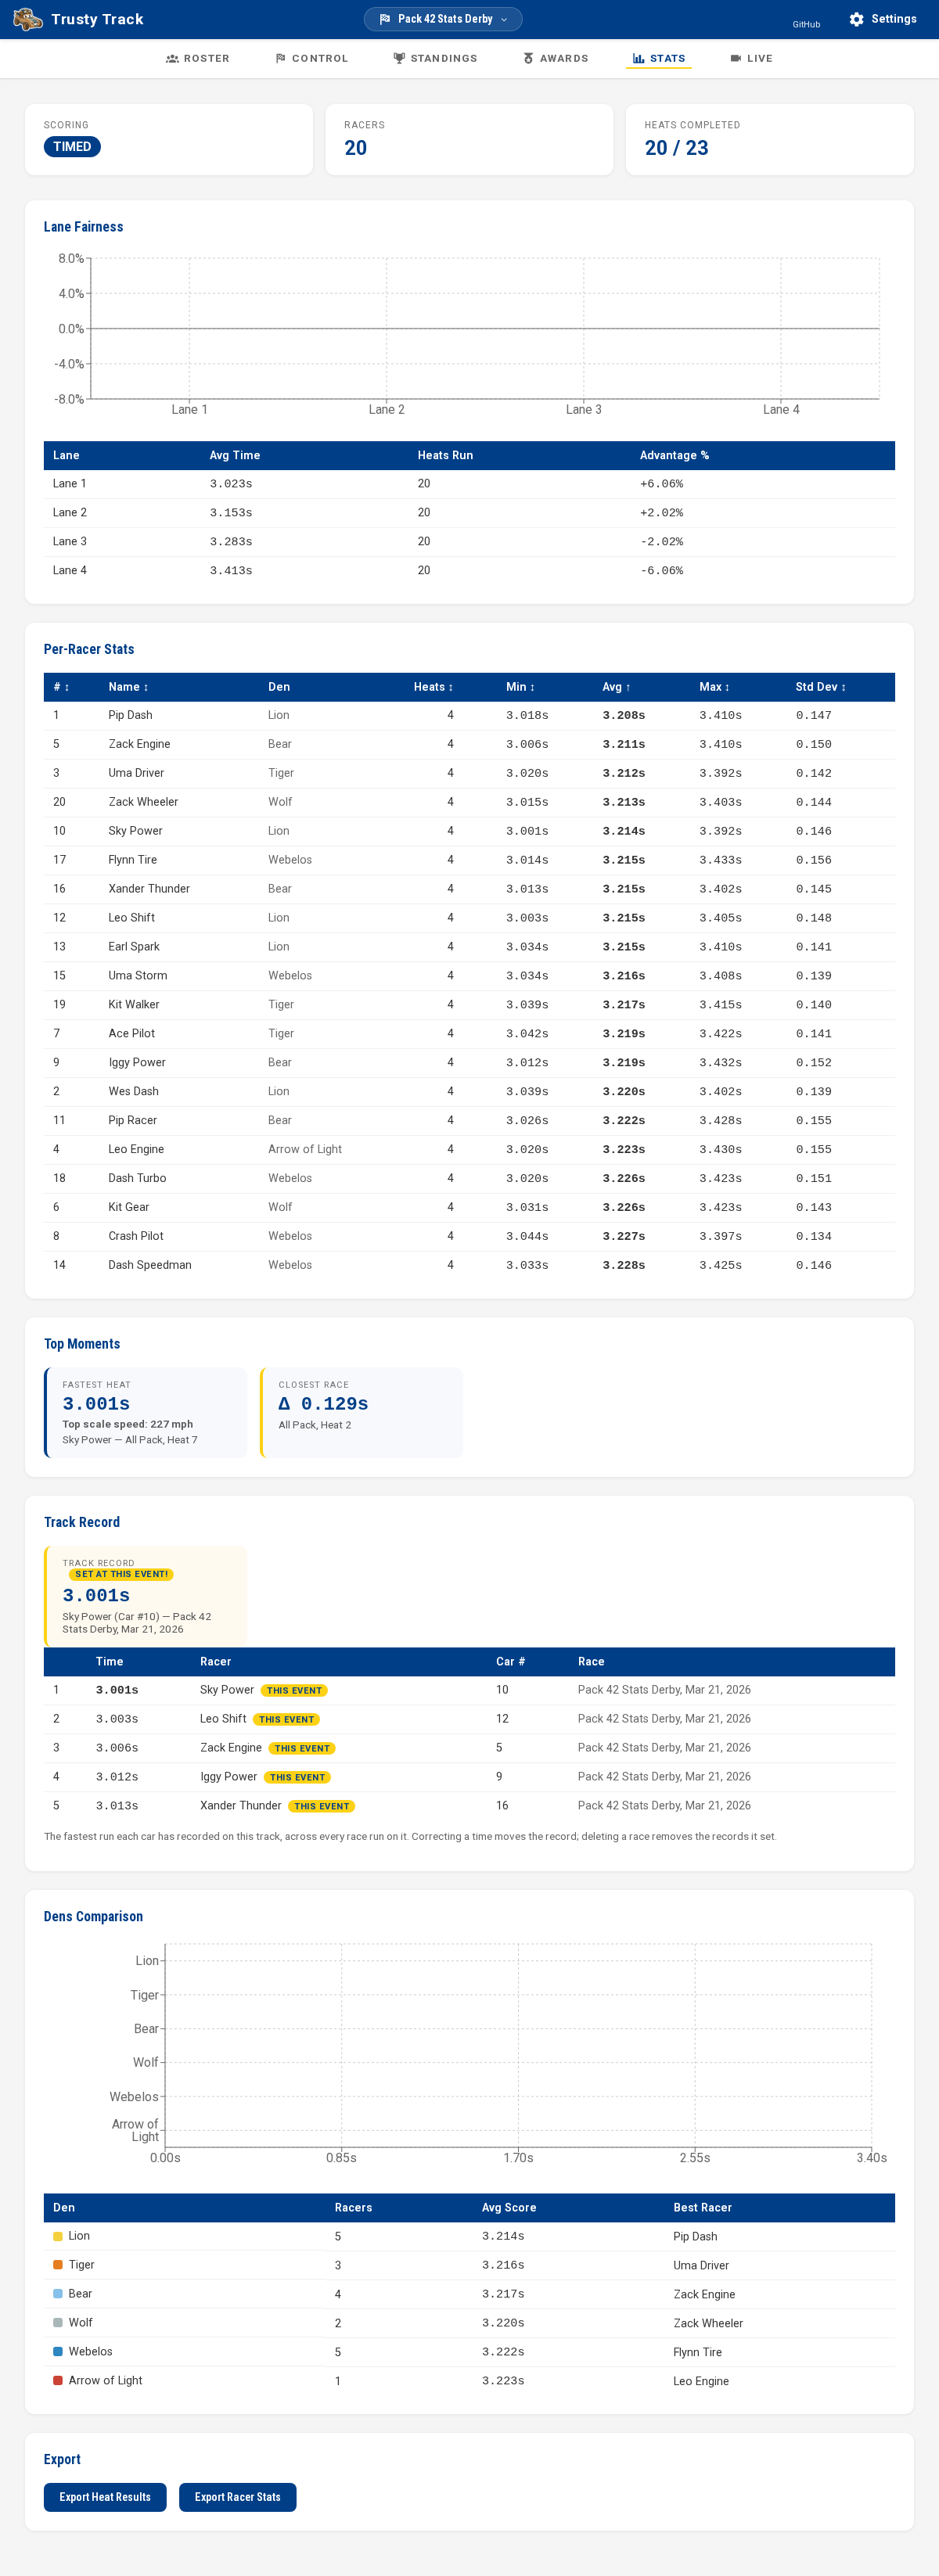 The Stats page during an in-progress race, with the Heats Completed card showing partial completion. The page refreshes automatically as heats finish.